
Child deaths, LGBT+ rights, electric vehicle sales, stopping aspiring autocrats, and more
A twice-monthly digest of our latest work plus curated highlights from across Our World in Data.


Welcome to The OWID Brief! In this edition we cover:
To reduce child mortality, we need to understand what children are dying from
Has Our World in Data been useful to you? We’d love to hear about it!
… and more.
🆕 OUR RECENT PUBLICATIONS AND UPDATES
Explore the interactive version of this chart →
To reduce child mortality, we need to understand what children are dying from
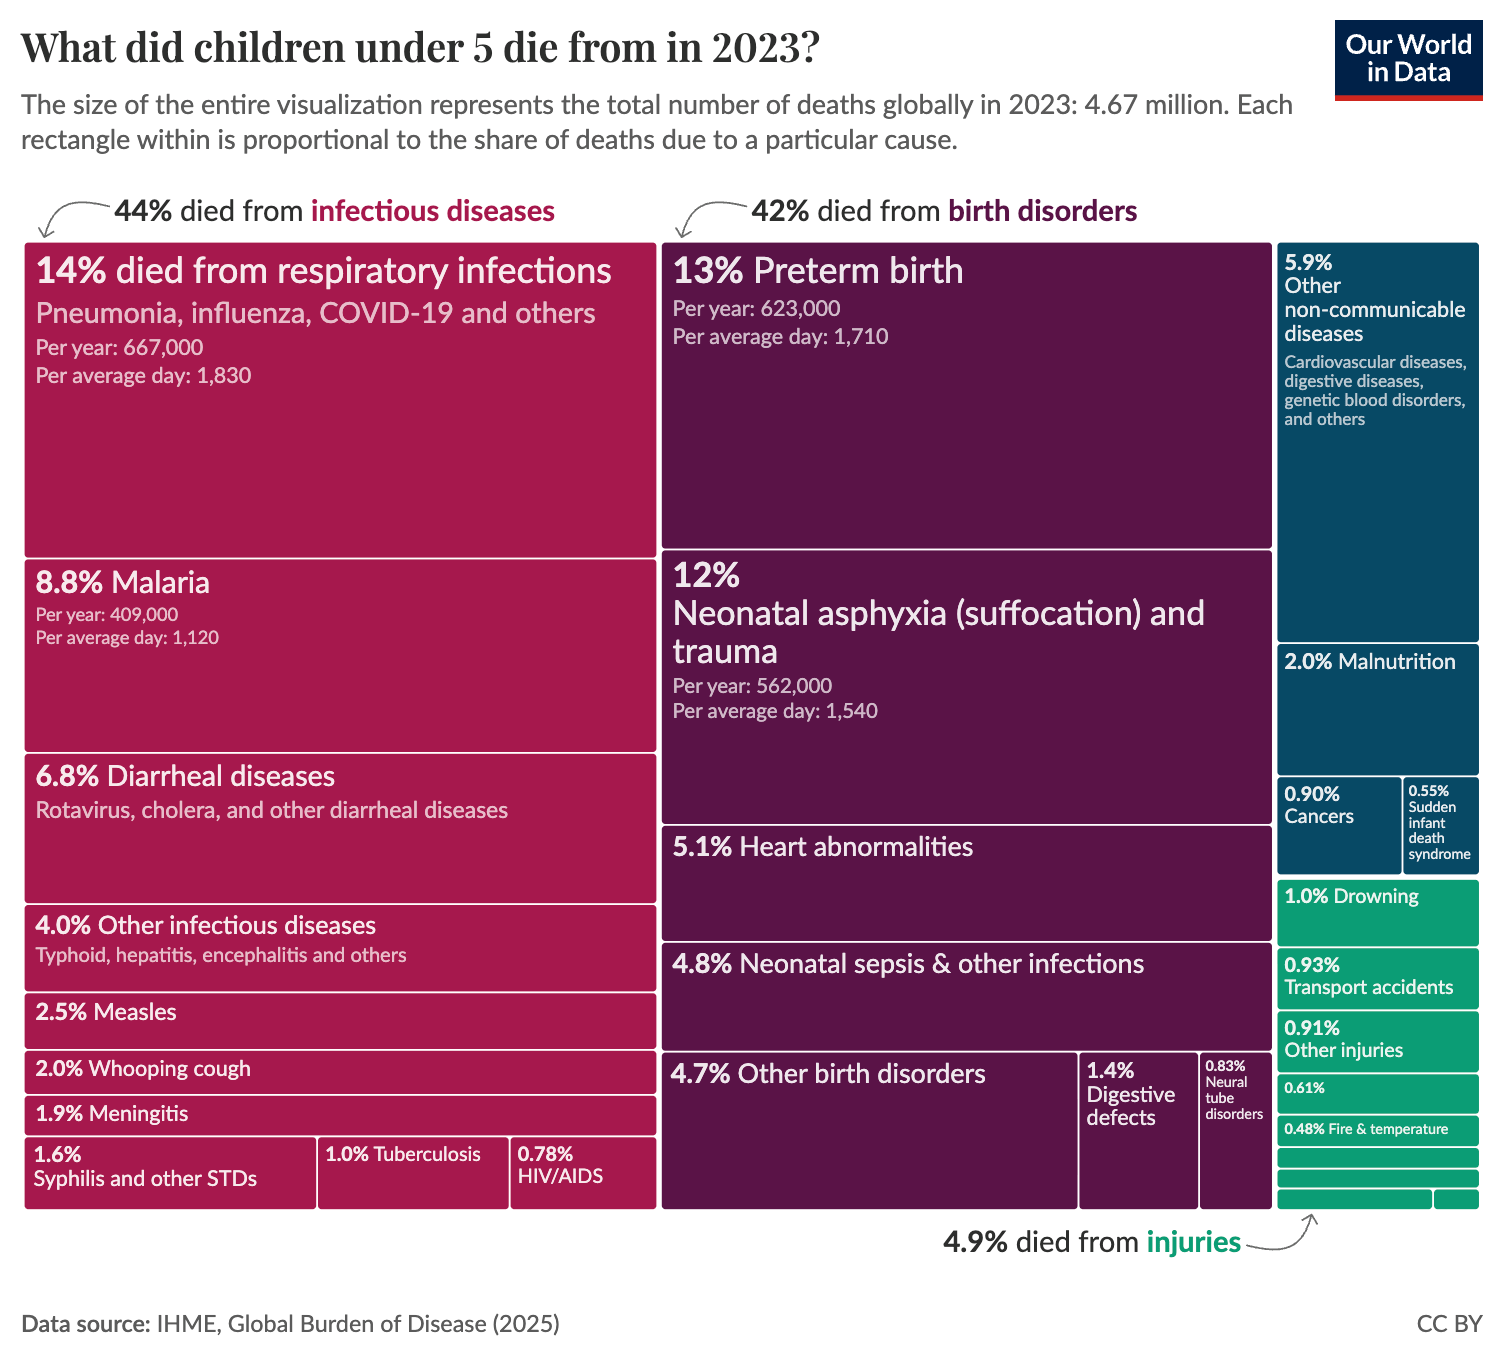
Five million children die every year. This is not only devastating due to the pain and loss that it represents, but also because most of these deaths are preventable.
To stop them, we need to understand what children are dying from. Our colleagues Sophia Mersmann and Fiona Spooner built a new interactive visualization to help do this, for every country in the world. Hannah Ritchie wrote an article that uses the visualization to walk you through the data.
At a global level, both infectious diseases and birth disorders (which are dominated by preterm births and neonatal suffocation) dominate deaths among children under five. Each category accounts for over 40% of the total.
The remaining deaths are caused by non-communicable diseases, such as cancer, or accidents such as drowning, road injuries, or fire.
This picture looks very different across income levels. In poorer countries, infectious diseases are even more prominent. In rich countries, they are far rarer, and non-communicable diseases and injuries account for a larger share.
What this data also reveals is that there are huge gaps in child mortality rates between countries. This is good news: it means we already know how to prevent most of these five million children dying.
The first step is knowing what they’re dying from. That’s what this new visualization tries to do.
We’d love to hear about it in our two-question survey!
Maybe our work helped you understand a global issue, explain something clearly to someone else, think differently about a problem, or make a decision. In your work, studies, or anywhere else in your life.
Thank you! This really helps us understand how our work is being useful for others.
📈 DATA INSIGHTS
Bite-sized insights on the world and how it’s changing

Since our last OWID Brief, we’ve published insights across various topics. Here’s a selection:
Coffee production has shifted toward Asia over the last six decades →
Most collected waste in many low- and middle-income countries is stored in open dumps or is burned →
Subscribe to our Data Insights newsletter
Our dedicated Data Insights newsletter delivers new insights right to your inbox every few days.
🌟 EXPLORE OUR FEATURED WORK
Explore the interactive version of this chart →
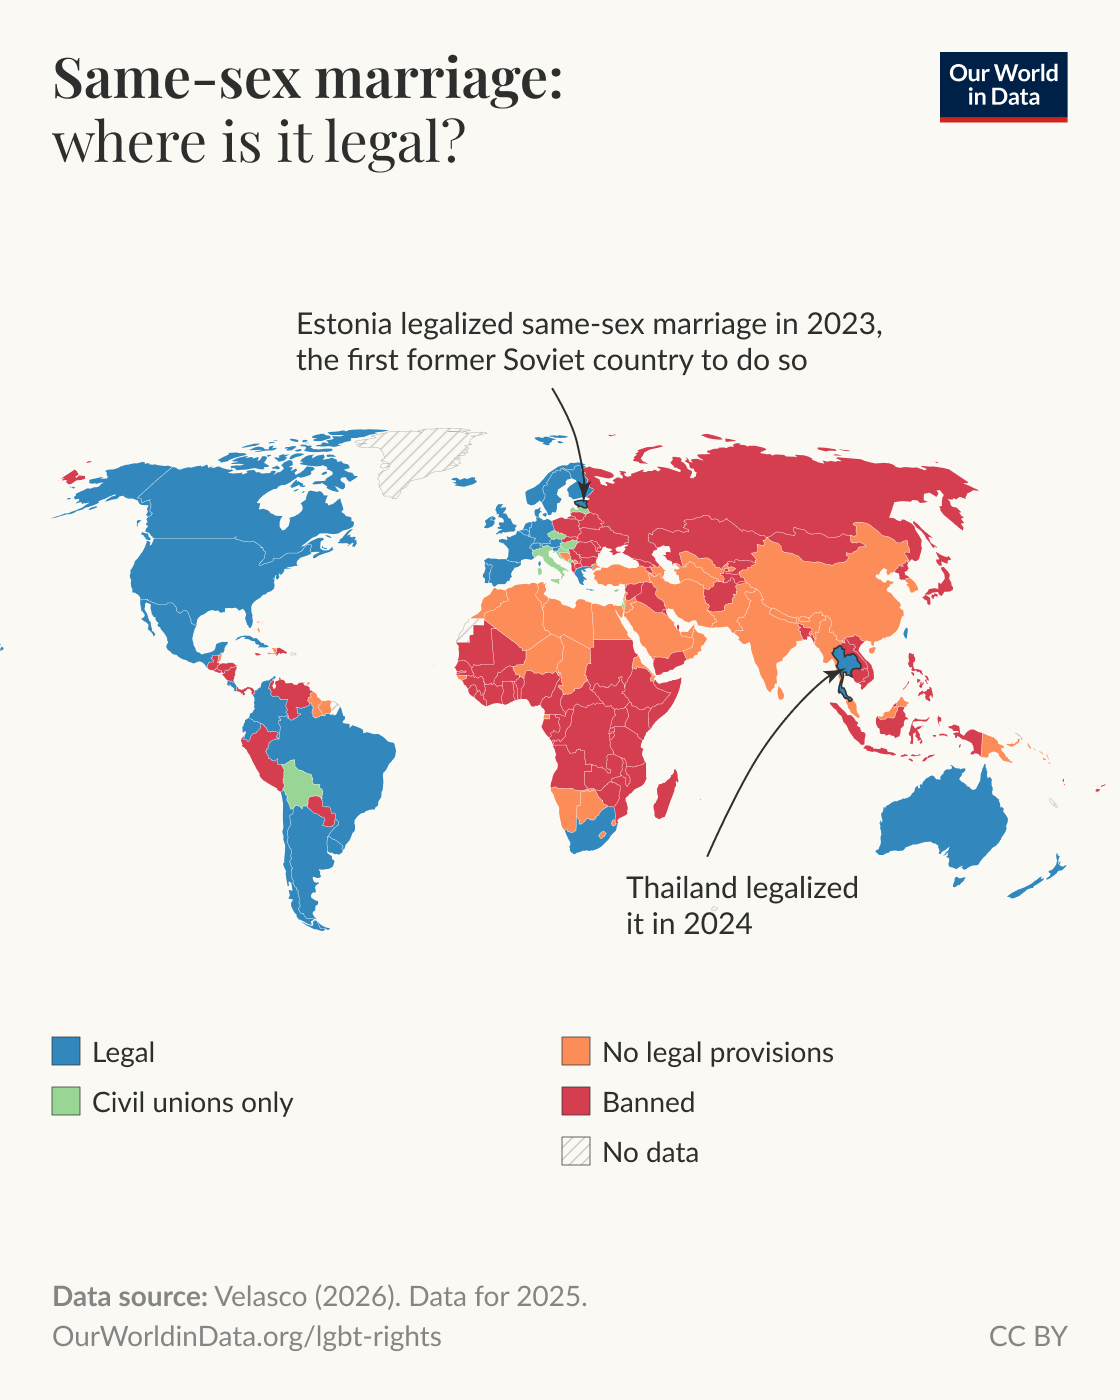
How do the rights of LGBT+ people vary around the world?
The map shows the 38 countries that allow same-sex partners to marry, affirming their right to love and form a family. However, the majority of countries don’t recognize same-sex marriage or outright ban it.
This data comes from the LGBTI National Policy Dataset, compiled by researcher Kristopher Velasco at Princeton University. It tracks the adoption, scope, and enforcement of 27 LGBTI-related policies across 197 countries, with annual data starting in 1991.
We recently updated this data with the 2026 release.
From our classics
📖 WHAT WE’VE BEEN READING

Can aspiring autocrats be stopped, and how?
As democracy loses ground to autocracy in many countries, this question is more pressing than ever.
To answer it, democracy researchers Javier Corrales and Susan Stokes identified and studied 27 cases of democratic erosion since 1999.
Their findings, shared in a recent article in the Journal of Democracy, are encouraging.
In three-quarters of cases, would-be autocrats were stopped short of fully eroding democracy in their country. They were usually succeeded by new leaders who halted or even reversed the erosion.
How were they stopped? Most commonly, by the mechanisms of democracy itself: elections and term limits.
Others were removed by their own parties or forced out by protests.
The common advice to “go vote” to defend democracy can sound trite. And it’s true that people can do much more than that.
But recent history shows that even increasingly unfair elections can be won if enough people turn out.
– Bastian

An AI model resolves a major open question in math
In 1946, mathematician Paul Erdős posed a now-famous problem in discrete geometry: the planar unit distance problem.
He put forward his own conjecture about the solution, and offered a monetary prize to anyone who could resolve it. For 80 years, no one could.
OpenAI recently announced that an internal model, working entirely on its own, had made a breakthrough on the problem by disproving Erdős’s conjecture and offering a better construction.
This marks the first time an AI has autonomously resolved a prominent open question central to a mathematical field.
Several mathematicians confirmed it. Tim Gowers, a Fields medalist (math’s highest honor), called it “a milestone in AI mathematics”.
The AI model was not specially trained on math or this problem in particular, but is a general reasoning model.
Those general capabilities could make it a useful research partner beyond math, such as in physics, engineering, biology, and medicine, potentially accelerating progress in those fields.
– Charlie
The mission of Our World in Data is to increase understanding of the world’s largest problems and drive informed action to solve them.
We are a nonprofit, building Our World in Data as a public good that’s freely available to everyone. Help us do more by supporting us with a donation.