
Economic inequality, AI energy use, Hannah Ritchie’s book, and more
A twice-monthly digest of our latest work plus curated highlights from across Our World in Data.


Welcome to The OWID Brief! In this edition we cover:
Hannah Ritchie’s book, Clearing the Air, is coming out in paperback in September
How have humans reshaped the world’s land over the millennia?
… and more. Check it out! ⬇️
🆕 OUR RECENT PUBLICATIONS AND UPDATES
We published a new topic page on economic inequality
Public attention to economic inequality has grown a lot over the last twenty years. At the same time, the available data has greatly improved too: it now covers many more countries and longer time periods, and is more comparable and accessible than ever.
But the wide range of sources and metrics can be hard to navigate. Each has its own strengths and weaknesses, and they cover many different definitions of inequality.
We’ve just published a new topic page on economic inequality to help make the data easier to understand.
It covers three key international datasets, each offering a different perspective: the World Inequality Database, the Luxembourg Income Study, and the World Bank’s Poverty and Inequality Platform.
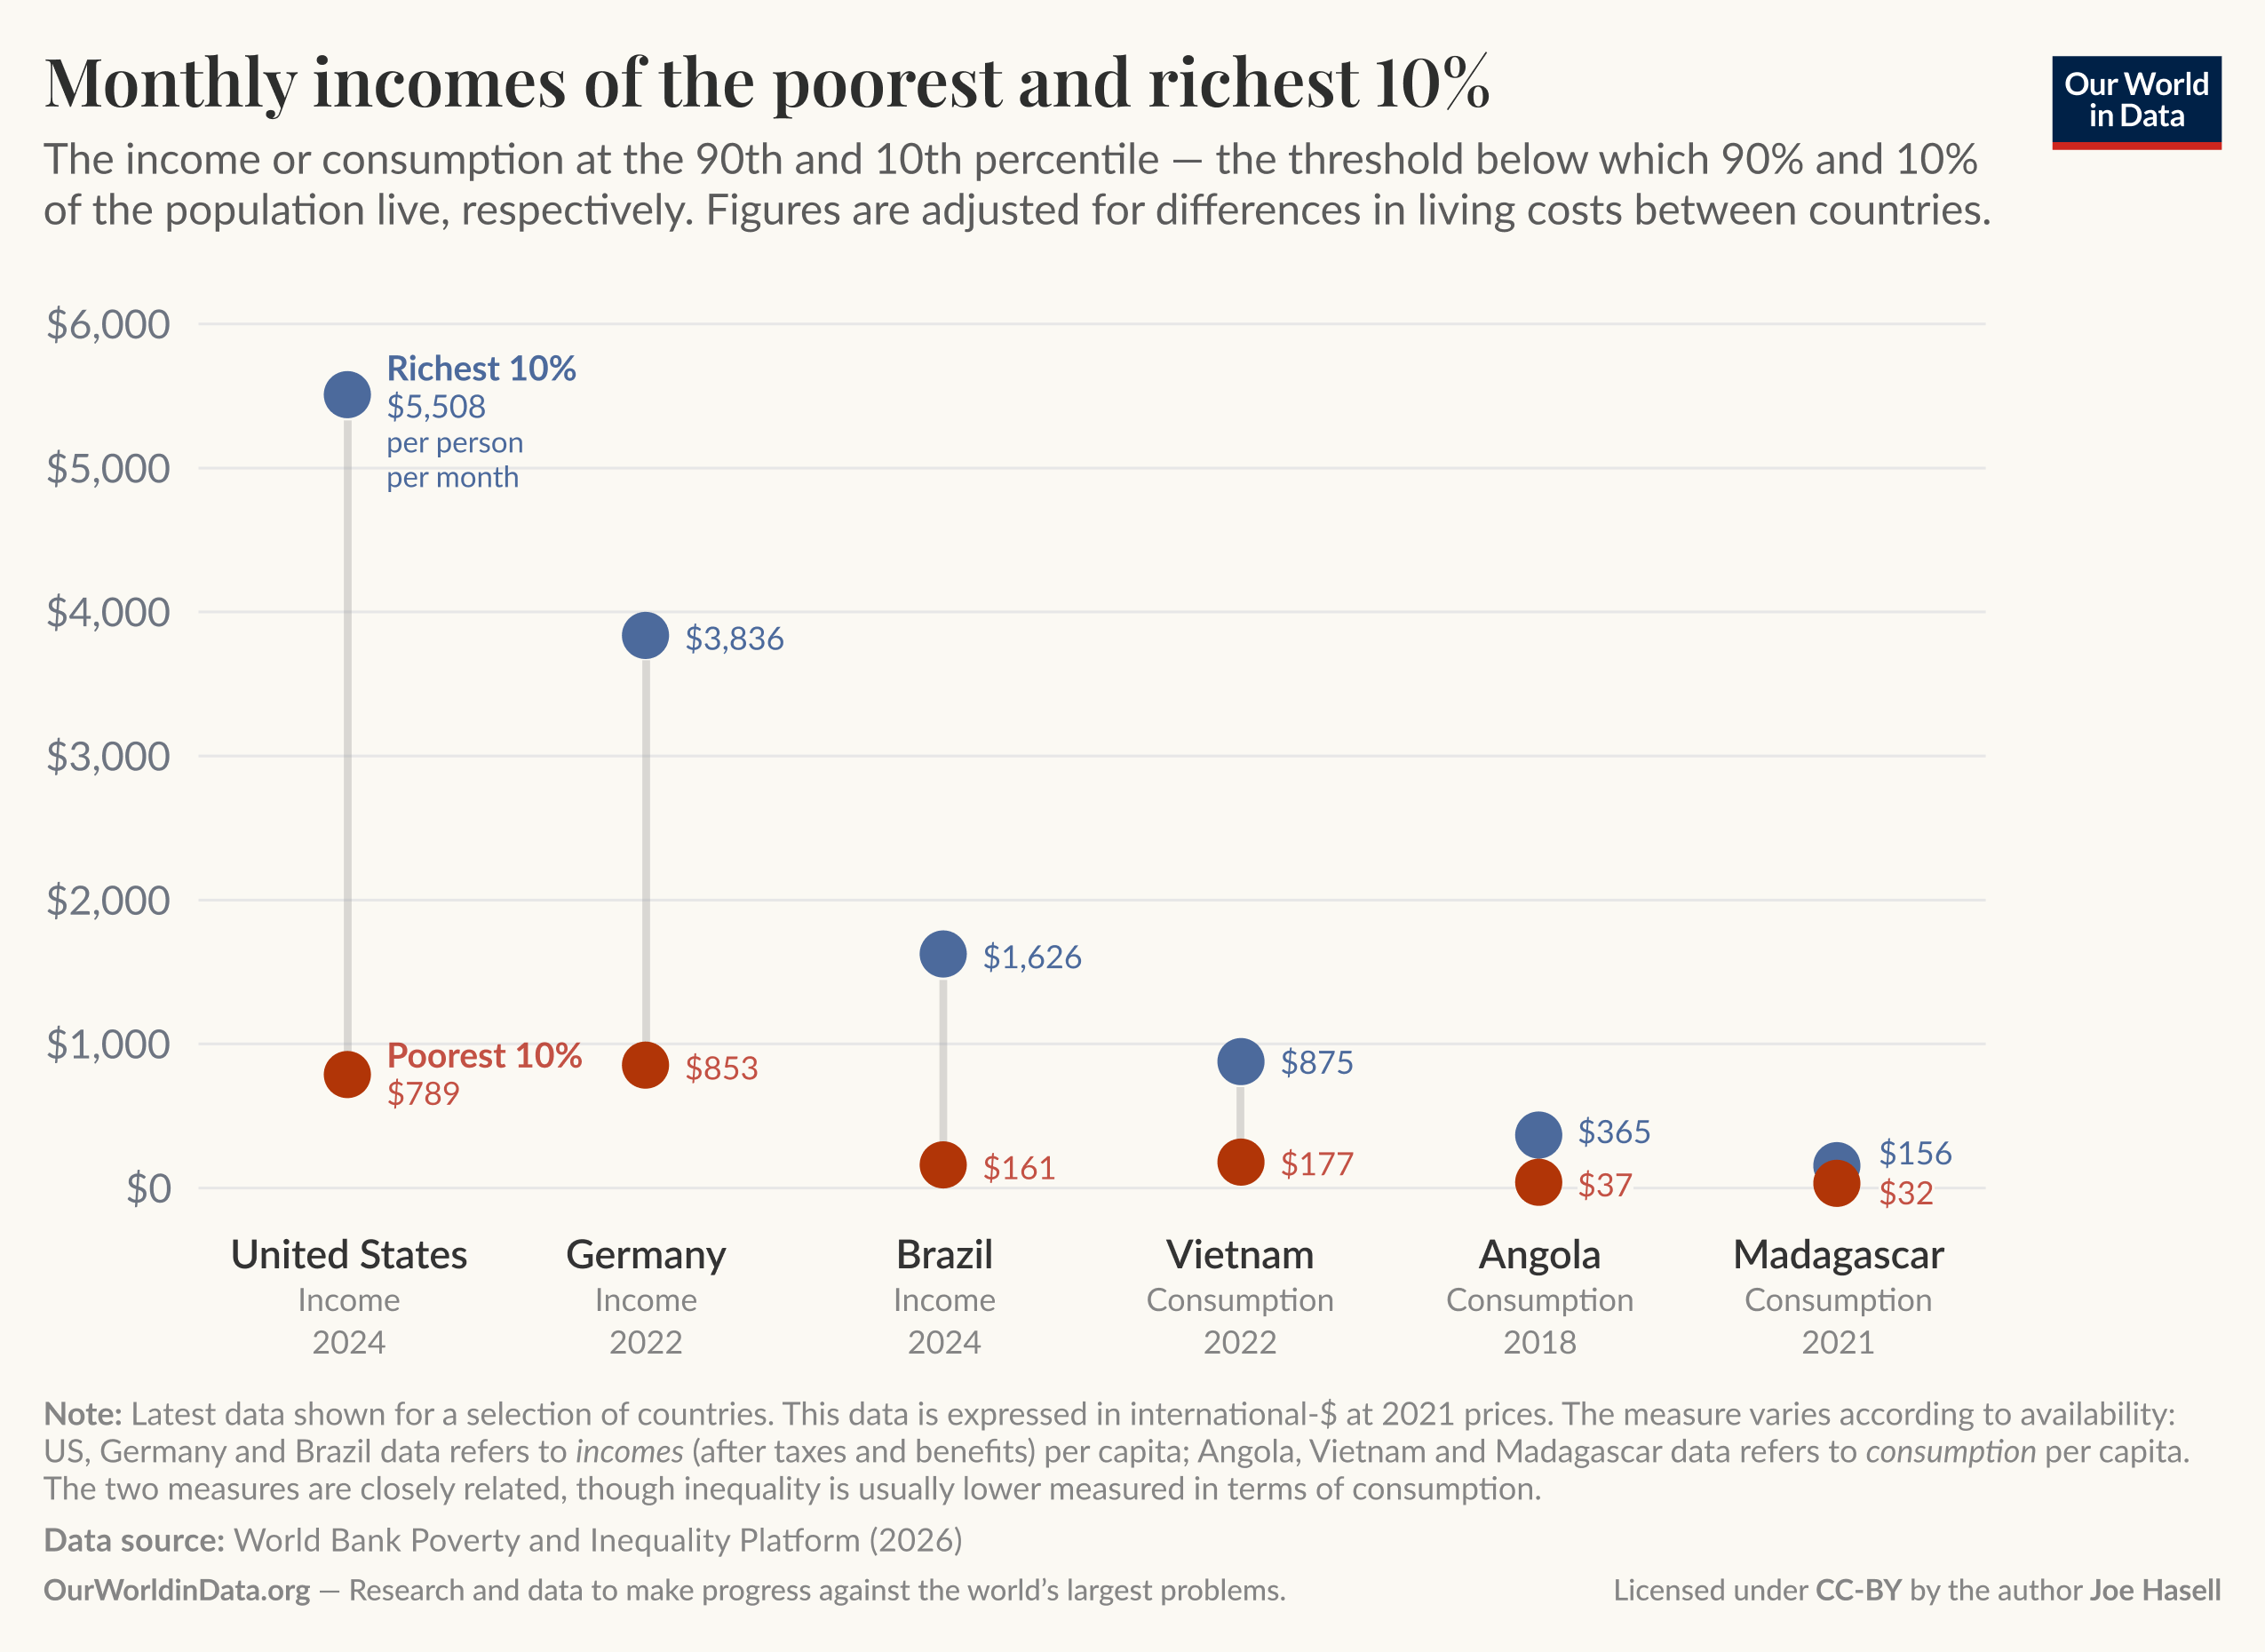
The World Bank data, for example, is a crucial source that allows us to compare income inequalities both within and between countries around the world.
In the chart, we show this for a selection of countries. We see that in the United States, there’s a 7-fold gap between the incomes of the poorest and the richest 10%. But even the poorest 10% in the US live on much more than the “rich” in a poor country like Madagascar.
Explore the interactive version of this chart →
How much energy do data centers and artificial intelligence use?
Artificial intelligence is being adopted rapidly across the world, and this is accelerating the demand for data centers that run these models.
One concern is what this means for energy demand, either for environmental reasons, pressures on local electricity supplies, or the risk that energy becomes the technology’s main bottleneck.
How much electricity did data centers consume last year?
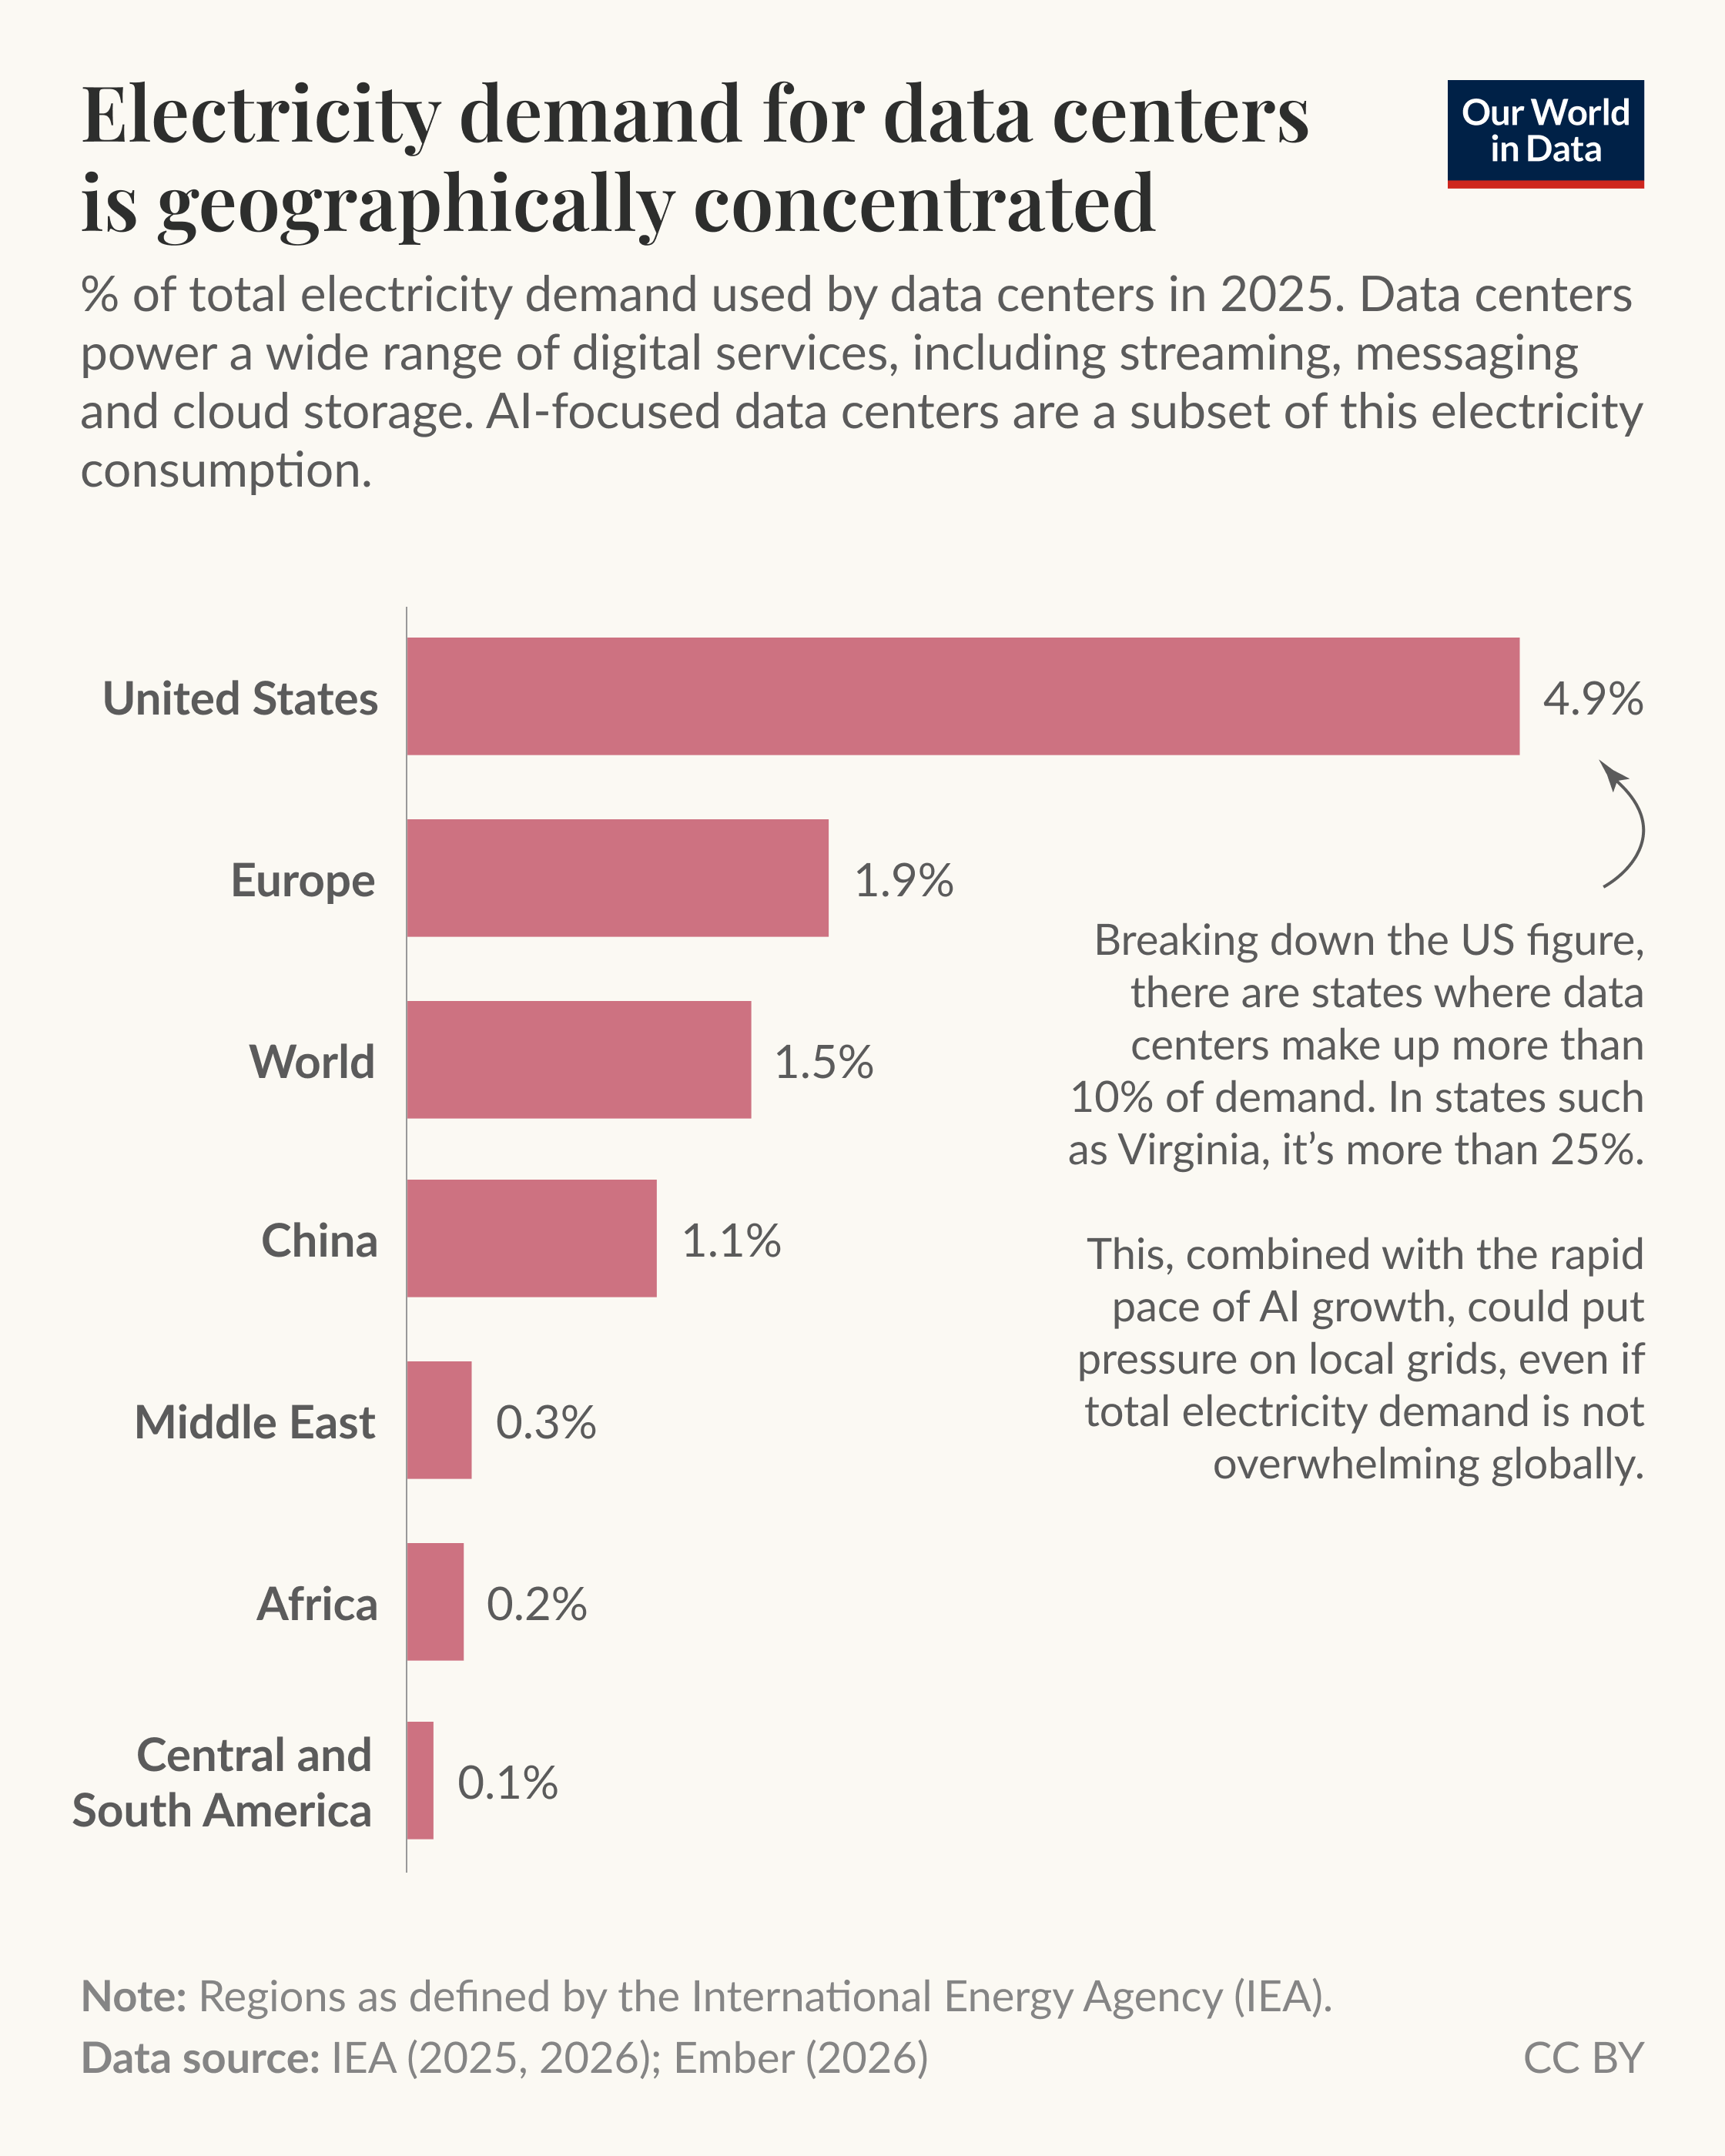
According to the International Energy Agency, around 485 terawatt-hours (TWh). That’s 1.5% of global electricity generation. AI-focused data centers on their own consumed 0.5% of global electricity.
This might not seem like a lot, but in some places, it makes up a much larger share. That’s because data center facilities are very geographically concentrated, which is arguably the bigger issue than total global demand for them. In the US, they consumed 5% of electricity. In some individual states, it was more than 20%. You can see this in the chart.
How this demand will grow in the future is very uncertain and depends on many factors, including demand for AI services and queries, and how chip and model efficiency improve.
When it comes to the climate impact of data centers, it’s not just electricity consumption that matters, but what sources it’s being supplied from. Data centers powered by a coal-dominated grid will have a much larger impact than those run from a renewables- or nuclear-heavy one.
As Hannah Ritchie explains in a new article, how the growth of AI affects emissions depends not just on its energy efficiency and demand, but also on how clean the grids are that supply it.
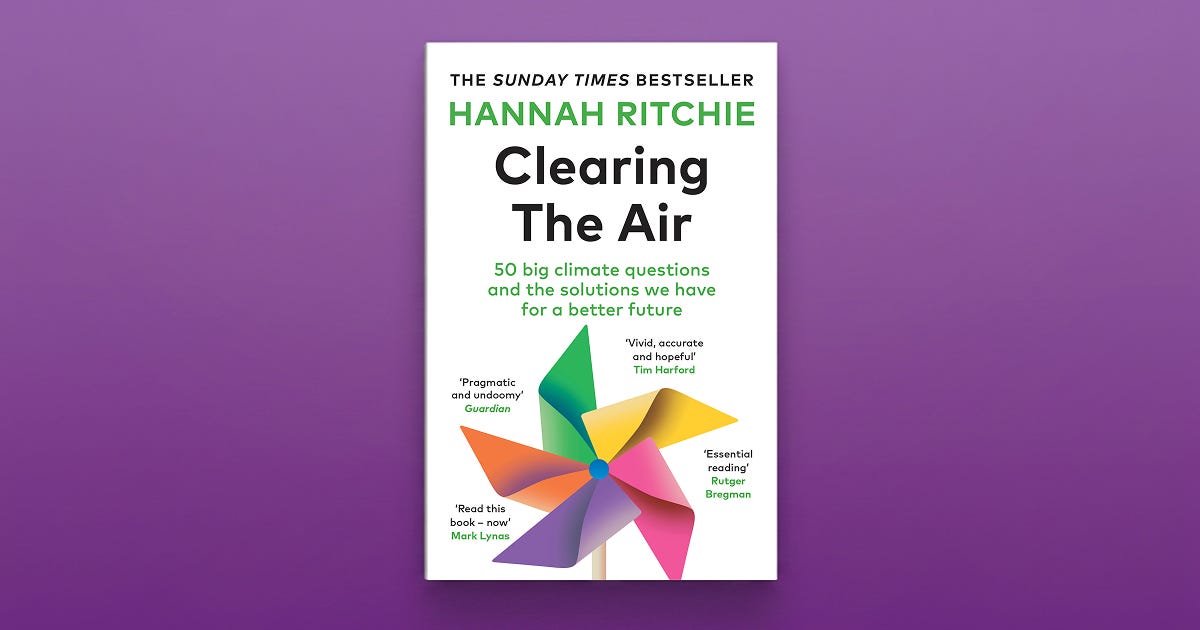
Hannah Ritchie’s book, Clearing the Air, is coming out in paperback in September
Hannah, our Deputy Editor and Science Outreach Lead, published her second book, Clearing the Air, last year in hardback.
The paperback version will soon come out in the UK — on 3rd September.
Hannah wrote about the renewed relevance of her book in a recent Substack post:
The recent record-breaking heatwaves in the UK (and other parts of the world) have, at least temporarily, put climate change back on the agenda. But as I’ve said many times before, the debate is no longer about whether climate change is happening, or if we should do something about it.
Most of the concern is about: Who should take action? How much will it cost? Do we have enough land for solar and wind? Won’t we run out of minerals, or create even more of a mining mess? What do we do about cement, or concrete, or aviation?
These are the types of questions — there are 50 of them! — that I cover in this book.
If you’d like to pre-order a copy of Clearing the Air in paperback, it makes a big difference because it convinces bookstores to stock it.
📈 DATA INSIGHTS
Bite-sized insights on the world and how it’s changing
Since our last OWID Brief, we’ve published insights across various topics. Here’s a selection:
Three-quarters of eggs produced in the United Kingdom are free-range →
Nearly half of young children in Guatemala suffer from stunting →
Rich countries have ten times as many doctors per person as poor ones →
Most of the world’s fastest-growing megacities will soon be in Africa →
In the past, most people worked in agriculture; in today’s rich countries, only a small share do →
Subscribe to our Data Insights newsletter
Our dedicated Data Insights newsletter delivers new insights right to your inbox every few days.
🌟 EXPLORE OUR FEATURED WORK
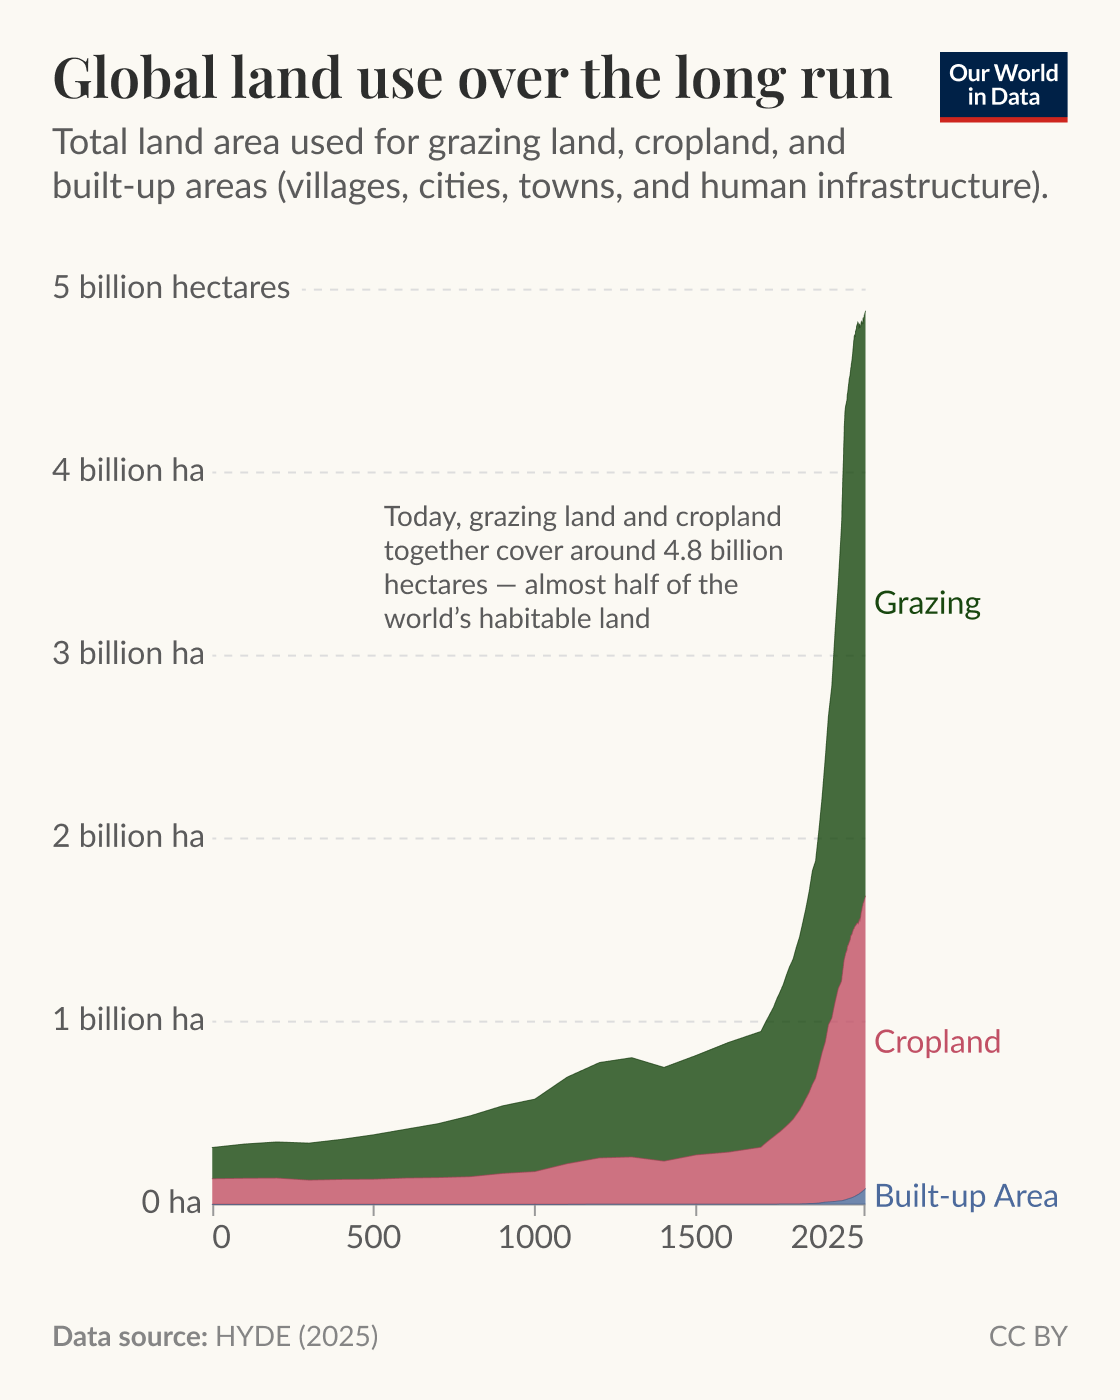
Explore the interactive version of this chart →
How have humans reshaped the world’s land over the millennia?
Over thousands of years, humans have gradually transformed the Earth’s surface — clearing land for agriculture (crops and grazing animals) and building settlements.
For most of that history, agriculture used little land from a global perspective. Today, cropland and grazing land together cover around 4.8 billion hectares — almost half of the world’s habitable land. Built-up area is comparatively tiny, at 86 million hectares. You can see this in the chart.
This insight comes from the History Database of the Global Environment (HYDE), the primary window we have into humanity’s land use and population over the very long run.
It’s built and maintained by researchers in the Netherlands, at the government’s Environmental Assessment Agency (PBL) and Utrecht University. The dataset covers 213 countries and regions and reaches back to 10,000 BCE.
Because it stretches so far into the past, its earliest figures are necessarily modeled reconstructions rather than direct measurements, so the uncertainty grows the further back in time you look.
Our colleague Lucas Rodés-Guirao recently updated our charts with the latest release, HYDE 3.5, which extends the data to 2025.
From our classics
The mission of Our World in Data is to increase understanding of the world’s largest problems and drive informed action to solve them.
We are a nonprofit, building Our World in Data as a public good that’s freely available to everyone. Help us do more by supporting us with a donation.
The gap in these numbers is what stands out — a poor Angolan household making $37/month and a rich American making $5,508/month isn’t a different economy, it’s a different planet, and the AI energy race is happening entirely on one side of that line.
I honestly can't think of anyone writing today who is doing better and more important work than Hannah.